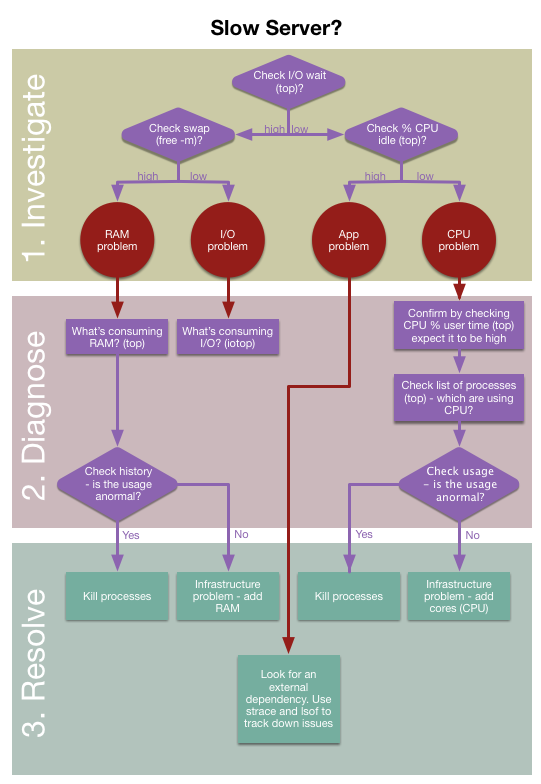
Slow server? Workflow to get the bottleneks
Your high-powered server is suddenly running dog slow, and you need to remember the troubleshooting steps again. Bookmark this page for a ready reminder the next time you need to diagnose a slow server.
Get on Top of it
Linux's top command provides a wealth of troubleshooting information, but you have to know what you're looking for. Reference this diagram as you go through the steps below:
Step 1: Check I/O wait and CPU idletime
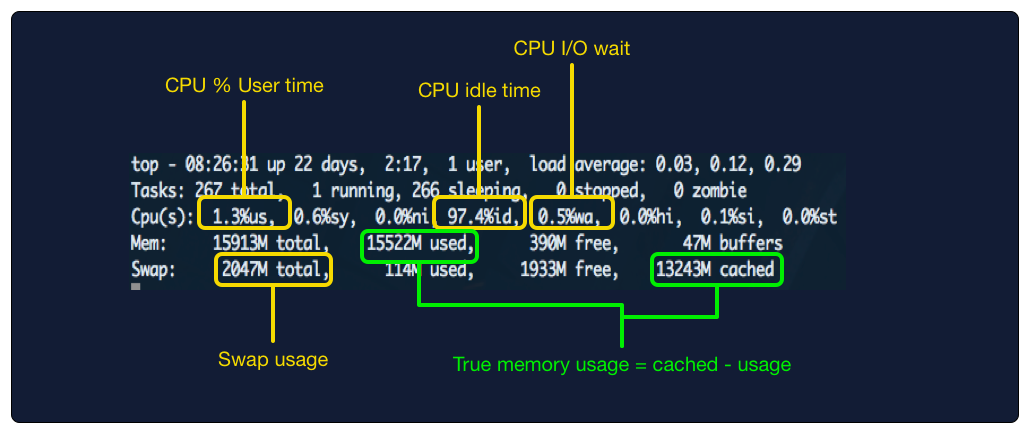
How: Use top - look for wa (I/O wait) and id (CPU idletime)
Why: Checking I/O wait is the best initial step to narrow down the root cause of server slowness. If I/O wait is low, you can rule out disk access in your diagnosis.
I/O Wait represents the amount of time the CPU waiting for disk or network I/O. Waiting is the key here, if your CPU is waiting, it's not doing useful work. It's like a chef who can't serve a meal until he gets a delivery of ingredients. Anything above 10% I/O wait should be considered high.
On the other hand, CPU idle time is a metric you want to be high -- the higher this is, the more bandwidth your server has to handle whatever else you throw at it. If your idle time is consistently above 25%, consider it high enough
Step 2: IO wait is slow and idle time is low
If IO wait is lsow and idle time is low, check CPU user time.
How: use top again -- look for the %us column (first column), then look for a process or processes that is doing the damage.
Why: at this point you expect the usertime percentage to be high -- there's most likely a program or service you've configured on you server that's hogging CPU. Checking the % user time just confirms this. When you see that the % usertime is high, it's time to see what executable is monopolizing the CPU
Once you've confirmed that the % usertime is high, check the process list (also provided by top). Be default, top sorts the process list by %CPU, so you can just look at the top process or processes.
If there's a single process hogging the CPU in a way that seems abnormal, it's an anomalous situation that a service restart can fix. If there are are multiple processes taking up CPU resources, or it there's one process that takes lots of resources while otherwise functioning normally, than your setup may just be underpowered. You'll need to upgrade your server (add more cores), or split services out onto other boxes. In either case, you have a resolution:
- If situation seems anomalous: Kill the offending processes.
- If situation seems typical given history: Upgrade server or add more servers.
This is an area where historical context can be a huge help in understanding what's going in. If you're using Scout, check out the historical charts for these metrics. A flat line for % user time followed by a huge increase in the last 10 minutes tells a much different story than smooth, steady increase over the last 6 months.
Step 3: IO wait is low and idle time is high
Your slowness isn't due to CPU or IO problems, so it's likely an application-specific issue. It's also possible that the slowness is being caused by another server in your cluster, or by an external service you rely on.
- Start by checking important applications for uncharacteristic slowness (the DB is a good place to start)
- Think through which parts of your infrastructure could be slowed down externally. For example, do you use an externally hosted email service that could slow down critical parts of your application?
If you suspect another server in your cluster, strace and lsof can provide information on what the process is doing or waiting on. strace will show you which file descriptors are being read or written to (or being attempted to be read from) and lsof can give you a mapping of those file descriptors to network connections.
STEP 4: IO wait is high
If I/O wait is high check your swap usage on the server.
How: Use top or free -m
Why: If your box is swapping out to disk a lot, the cache swaps will monopolize the disk and processes with legitimate IO needs will be starved for disk access. In other words, checking disk swap separates real IO wait problems from what are actually RAM problems that look like IO Wait problems.
An alternative to top is free -m, this is useful if you find top's frequent updates frustrating to use, and you don't have any console log of changes.
free -m
             total       used       free     shared    buffers     cached
Mem:         15913      15772        141        128         27      13303
-/+ buffers/cache:       2441      13472
Swap:         2047        109       1938
Step 5: Swap usage is high
High swap usage means that you are actually out of RAM. See step 6 below.
Step 6: Swap usage is low
Low swap means you have a "real" IO wait problem. The next step is to see what's hogging your IO.
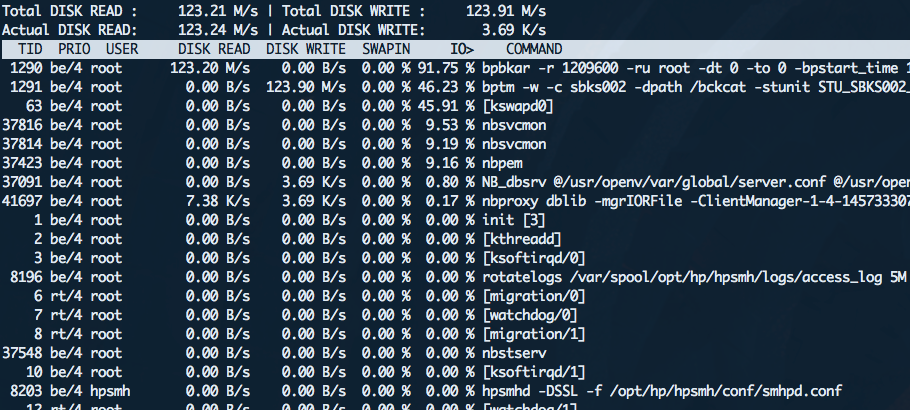
iotop is an awesome tool for identifying io offenders.
Two things to note:
Unless you've already installed iotop, it's probably not already on your system.
Recommendation:
Install it before you need it -- it's no fun trying to install a troubleshooting tool on an overloaded machine.
Note: iotop requies a Linux of 2.62 or above!
Step 7: Check memory usage
How: use top. Once top is running, press the M key - this will sort applications by the memory used.
Important: don't look at the free memory -- it's misleading. To get the actual memory available, subtract the "cached" memory from the "used" memory. This is because Linux caches things liberally, and often the memory can be freed up when it's needed. Read here (Determining free memory on Linux) for more info.
Once you've identified the offenders, the resolution will again depend on whether their memory usage seems business-as-usual or not. For example, a memory leak can be satisfactorily addressed by a one-time or periodic restart of the process.
if memory usage seems anomalous: kill the offending processes.
if memory usage seems business-as-usual: add RAM to the server, or split high-memory using services to other servers.
Flowchart to tie all toghether
Additional tips
vmstatis also a very handy tool, because it shows past values instead of an in-place update like top. Runningvmstat 1shows concise metrics on memory, swap, io, and CPU every second.
vmstat 1
procs -----------memory---------- ---swap-- -----io---- -system-- -----cpu------
 r  b   swpd   free   buff  cache   si   so    bi    bo   in   cs us sy id wa st
 2  0 116972 404856  46300 13560012    0    0   329    36    2    1  1  1 97  1  0
 0  0 116972 404748  46304 13560132    0    0     0     0 2154 5669  3  1 97  0  0
0 0 116972 405036 46304 13560132 0 0 0 0 1712 3659 0 0 99 0 0- Track your disk IO latency and compare to IOPS (I/O operations per second). Sometimes it's not activity in your own server causing the disk IO to be slow in a cloud/virtual environment. Proving this is hard, and you really want to have graphs of historical performance to show your provider!
- Increasing IO latency can mean a failing disk or bad sectors. Keep an eye on this before it escalates to data corruption or complete failure of the disk.
- A monitioring system like Nagios/Icinga also can help to figure out the bottlenek. See next chapter.
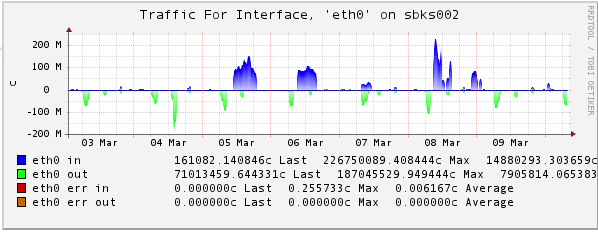
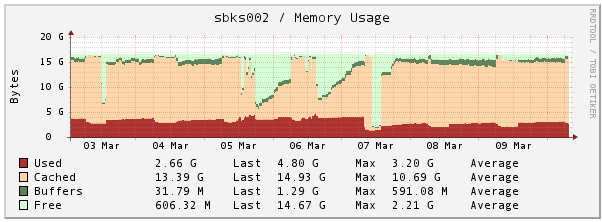
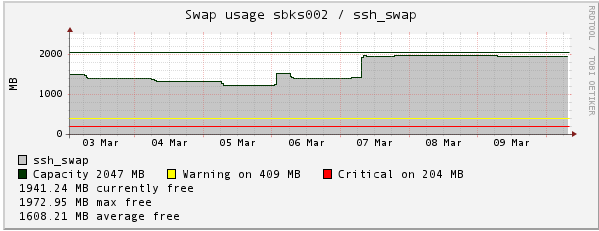
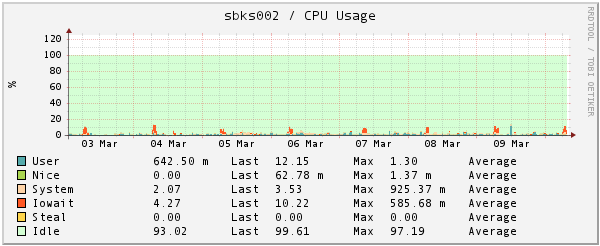
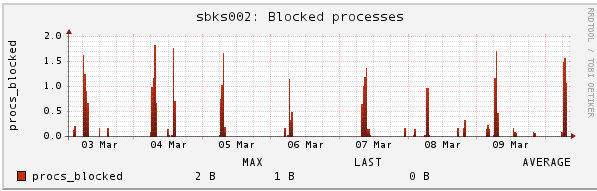
Icinga graphs (pnp4nagios)
Here a few really relevant graph, which influence the performance on a server. All graphs are taken from Icinga monitoring.
Memory
Swap
CPU
Network